
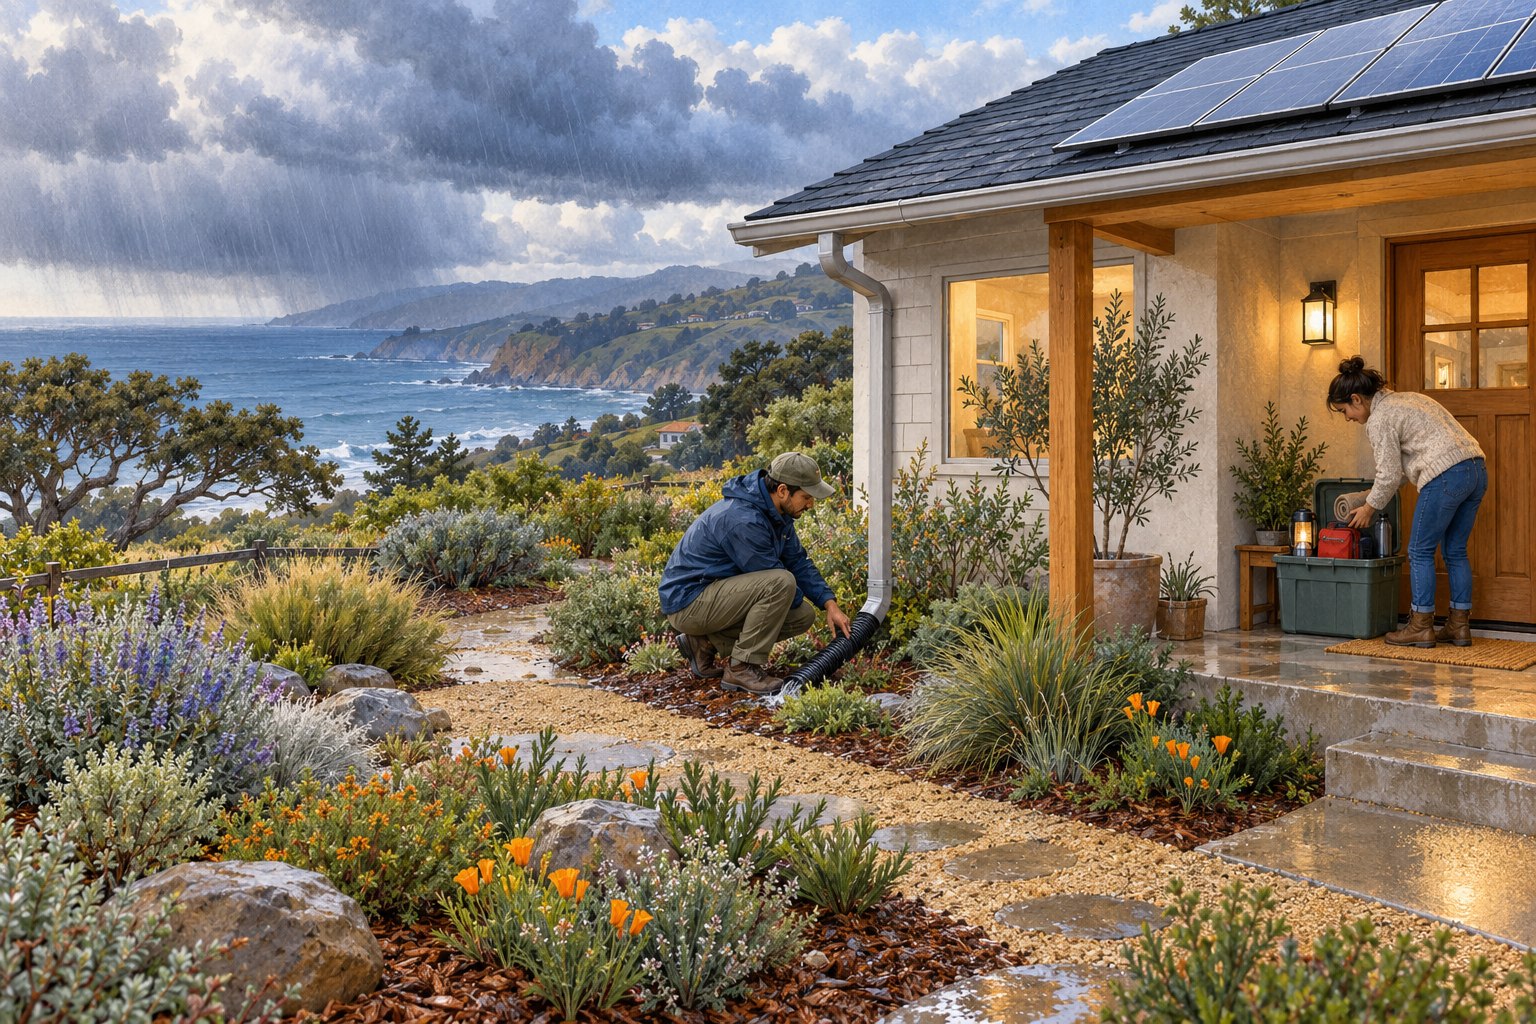
There is something reassuring about getting ready before the first big storm: a clear gutter, a charged phone, a neighbor who knows you will check in. California’s strengthening El Niño makes this a good autumn to take those small steps. You do not need to buy a whole-house battery or turn your garden into a fortress to make a useful start.
The opportunity is to understand the forecast, look at your own home’s weak spots, and prepare thoughtfully. That protects people and belongings and helps us look after one another when the weather gets difficult.
El Niño begins with a conversation between ocean and air.
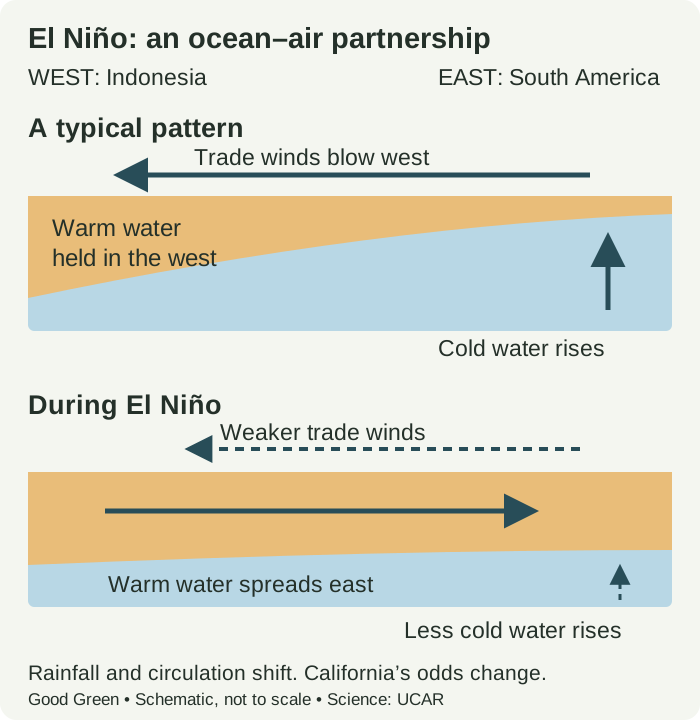
El Niño is the warm phase of the El Niño–Southern Oscillation, or ENSO: an irregular cycle involving the tropical Pacific Ocean and the atmosphere above it. It develops roughly every two to seven years, rather than arriving on a fixed schedule. The unusually warm water is in the central and eastern equatorial Pacific, thousands of miles from California. UCAR’s ENSO explainer
In a more typical pattern, trade winds blow east to west and push warm surface water toward Indonesia. Cooler water rises in the eastern Pacific to replace it, a process called upwelling. When the trade winds weaken, warm water spreads farther east and upwelling weakens. Tropical rainfall shifts with the warm water, changing atmospheric circulation and influencing weather far away. UCAR’s illustrated science guide
What starts the change?
There is no single switch that starts every El Niño. Ocean heat stored below the surface, changes in winds, and short bursts of westerly winds can help an event develop. The ocean and atmosphere then reinforce one another: warmer eastern waters alter rainfall and pressure patterns, which can weaken the trade winds further. Scientists call that reinforcing loop Bjerknes feedback. It explains how an event can grow; it does not make its timing or strength perfectly predictable. UCAR’s explanation of development and forecasting
Is climate change causing it?
El Niño is a natural cycle. Human-caused warming changes the climate in which it unfolds. Those are related but distinct ideas: we should not label an individual El Niño as caused by greenhouse gases. The IPCC finds that ENSO-related rainfall variability is expected to intensify as the climate warms, even though changes in the magnitude of ENSO’s ocean-temperature swings remain uncertain. Cutting emissions and preparing for damaging weather are both useful responses. IPCC assessment of water-cycle changes
What scientists expect for winter 2026–27.
What changed: NOAA raised the October–December chance of reaching at least +2.5°C on its three-month relative ocean-temperature index from September’s 75% to 83%. Its November–January estimate is 70%. These are different seasons, not conflicting forecasts. Read the October report (PDF).
That gives us another reason to prepare early. It does not predict how much rain will fall in California or when a local storm will arrive. The October 5 weekly report (PDF) remains useful background, but today’s monthly discussion supersedes its carried-forward strength forecast.
A university cross-check supports the broad picture.
Columbia’s CCSR/IRI September 21 model assessment reports that all 22 participating models forecast a very strong El Niño from September–November through December–February. That agreement supports taking winter preparation seriously. It does not mean California flooding is certain. Columbia uses the traditional Niño 3.4 temperature index, while NOAA’s current outlook uses a relative index; their strength measures should not be treated as interchangeable.
University of California climate scientist Daniel Swain describes a stronger tilt toward a wetter winter, especially in Central and Southern California, and toward individual heavy-rain events. Higher coastal water levels and stronger wave action can also increase erosion and flooding risks when storms coincide with high tides. His assessment places important impacts from late autumn into winter, potentially lingering into March. A very strong event still does not guarantee specific outcomes. Swain’s California assessment
What do the rainfall odds mean for California?
The rainfall outlook has a different update schedule. The latest seasonal discussion we verified remains September 17, with its next release scheduled for October 15. The regional figures below have not been revised by today’s ENSO report. Dated seasonal outlook and next release
The September 17 seasonal outlook favors above-normal precipitation across the southern half of California for October–December. For December–February, January–March, and February–April, its discussion describes the strongest California wet-season odds near the coast: a 50–60% chance of above-normal precipitation. This is a regional outlook, not an address-specific forecast for San Luis Obispo.
Those percentages mean the chance of landing in the wettest third of historical seasonal totals. They do not mean 50–60% more rain, that it will rain on most days, or that there is a 50–60% chance your home will flood. A wet seasonal tilt still leaves room for dry stretches.
For a Central Coast household, that points to sensible questions: where does water collect, which roads or creek crossings become impassable, and what happens if the power goes out? These are preparation priorities, not a forecast that your particular street will flood.
| Information | What it helps you understand | What it cannot promise |
|---|---|---|
| El Niño outlook | The likely state and strength of the tropical ocean–atmosphere pattern. | The rainfall total or flood risk at a specific home. |
| Seasonal rain outlook | Whether a region favors a wetter, near-average, or drier season. | The arrival date or severity of an individual storm. |
| Local forecasts and warnings | Approaching storms, hazards, and instructions for your area. | A reason to ignore changing conditions or evacuation orders. |
Follow the seasonal outlook for the broad picture and local weather warnings when storms approach. UC’s flood-preparation hub brings the science and practical resources together. El Niño raises or lowers odds; it does not schedule the weather.
A preparation guide that starts with what you have.
Start with maintenance and a plan. Then spend on the gap that matters most to your household. KQED’s reporting emphasizes early work on roofs, gutters, trees, and drainage rather than waiting for a storm warning. Hire appropriate help for roof work or large trees; do not climb onto a wet roof. KQED’s preparation guide
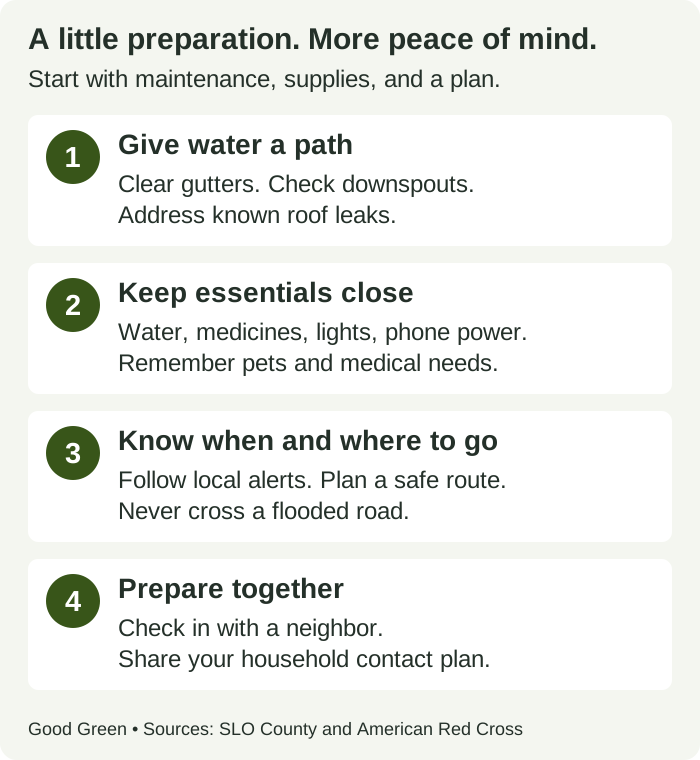
- Give water a safe path. Clear gutters and accessible drainage, check downspouts, and address known leaks. Avoid redirecting water onto a neighbor’s property. If your home has flooded before, ask local authorities about appropriate sandbags or flood barriers. SLO County storm checklist
- Build a household plan. Gather water, shelf-stable food, medicines, flashlights, phone charging, and pet supplies. Keep important documents accessible. Plan how everyone will communicate if home power or internet fails. Red Cross outage guidance
- Know your alerts and routes. Use your county’s emergency-alert system and learn an alternative route before roads close. San Luis Obispo County residents can start with PrepareSLO. Never drive or walk through floodwater. County safety guidance
- Check insurance before the rain. Most homeowners and renters policies exclude flood damage. NFIP flood coverage generally has a 30-day waiting period, with exceptions. Ask your insurer what is covered, when coverage begins, and whether belongings or temporary housing have separate limitations. Flood insurance details
- Make readiness a shared project. Arrange a check-in with a neighbor, especially someone who may need help during an outage. Share reliable local alerts and agree on a contact person. A five-minute conversation can be a useful first step.
When a warning arrives, act on local instructions rather than the seasonal forecast. If officials tell you to evacuate, leave promptly. Avoid downed power lines and electrical equipment exposed to floodwater. Red Cross electrical safety guidance
Cleaner backup power: match the battery to the job.
A charged phone bank and LED light may cover your first priorities. A larger battery can be useful for selected equipment, but compare its usable energy, output power, and the actual loads you want to run. Our phone-battery guide and home-storage guide explain those choices. A major purchase is worth considering against your needs and budget, not simply an alarming headline.
Keep batteries dry and follow their instructions. For essential medical equipment, plan with the equipment provider and your care team; a generic runtime estimate is not enough. If using a fuel-powered generator, keep it outdoors at least 20 feet from doors, windows, and vents. Never use it indoors or connect it to household wiring without approved transfer equipment. Check carbon-monoxide alarms. County generator guidance · Red Cross backup-power guidance
Sources, dates, and what we will update.
Published October 6, 2026. Updated October 8, 2026. We compared NOAA’s new October 8 monthly ENSO discussion with its September assessment, the October 5 weekly report, Columbia’s September 21 model assessment, and NOAA’s September 17 seasonal outlook, alongside University of California analysis. Columbia’s latest text assessment remains September 21; it is a cross-check, not a new October forecast. The issue date belongs to the source; the update date records our review. The Pacific graphic is an original schematic based on UCAR explanations; the checklist combines county and Red Cross guidance. Neither is a measured forecast or a map of local flood risk.
The next seasonal rainfall outlook is scheduled for October 15, and the next monthly ENSO discussion for November 12. Before relying on these seasonal numbers later in the winter, follow the current forecast links. Send corrections through our contact form. Our editorial goal is useful preparation supported by evidence while being honest about an unpredictable winter.
- UCAR: ENSO causes, feedbacks, and prediction
- UCAR Center for Science Education: ocean and wind mechanisms
- UC ANR: Daniel Swain’s August 2026 California assessment
- NOAA CPC: October 8, 2026 discussion; this live page changes monthly
- NOAA CPC: weekly ENSO report checked October 8; report dated October 5, 2026
- Columbia CCSR/IRI: September 21, 2026 ENSO model assessment
- NOAA CPC: September 17, 2026 seasonal outlook; this live page changes monthly
- IPCC AR6: water-cycle changes and ENSO rainfall variability
- KQED: California home preparation
- San Luis Obispo County: storm safety checklist
- American Red Cross: outage and backup-power safety
- NFIP: flood coverage and waiting periods